KqkRtN
Platform Insights Analyst
2
MONTHS
2 2 MONTHS OF SERVICE
LEVEL 1
500 XP
Detecting any intrusion in your system is a very important step towards Incident response. Incident response is quite vast, but it is always better to start small. While performing incident response, you should always focus on suspected systems and the areas where it seems there could be a breach. Making use of Incident Response, you could detect a large amount of attacks at the primary level.
The purpose of incident response is nothing but Live Forensics. The investigation can be carried out to obtain any digital evidence. This article mainly focuses on how the incident response can be performed in a Linux system. So, to get you started with this cheatsheet, switch on your Linux machine and open terminal to accomplish these commands.
Table of Contents
What is Incident Response?
Incident Response can be defined as a course of action that is taken whenever a computer or network security incident occurs. As an Incident Responder, you should always be aware of what should and should not be present in your system.
The security incidents that could be overcome by:
User Accounts
As an Incident Responder, it is very important to investigate the user account’s activity. It helps you understand the logged-in users, the existing users, usual or unusual logins, failed login attempts, permissions, access by sudo etc. The various commands to check the user account activity:
To identify whether there is an account in your system that may seem suspicious. This cat command usually fetches all the information about the user account. To do so, type

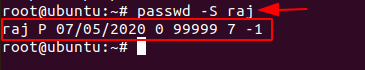
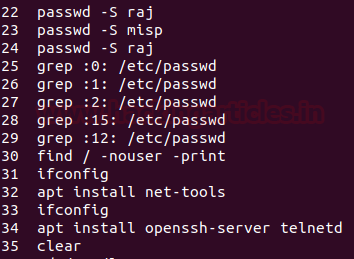
The’ Setuid’ option in Linux is unique file permission. So, on a Linux system when a user wants to make change of password ,they can run the ‘passwd’ command. As the root account is marked as setuid, you can get temporary permission.
Grep is used for searching plain- text for lines that match a regular expression. :0: is used to display ‘UID 0’ files in /etc/passwd file.

To Identify and display whether an attacker created any temporary user to perform an attack, type

The /etc/shadow contains encrypted password, details about the passwords and is only accessible by the root users.

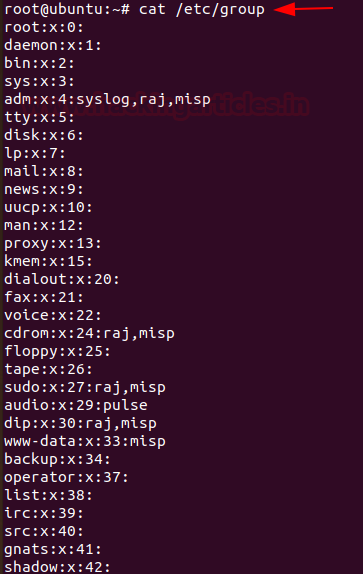
The group file displays the information of the groups used by the user. To view the details, type
If you want to view information about user and group privileges to be displayed, the/ etc/sudoers file can be viewed

Log Entries
To view the reports of the most recent login of a particular user or all the users in the Linux system, you can type,

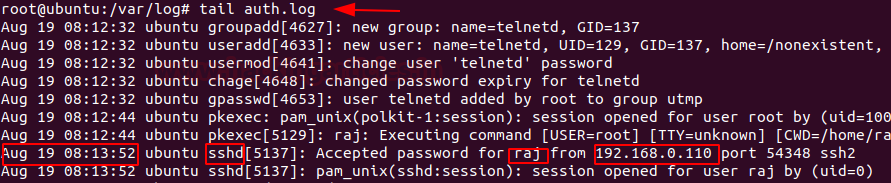
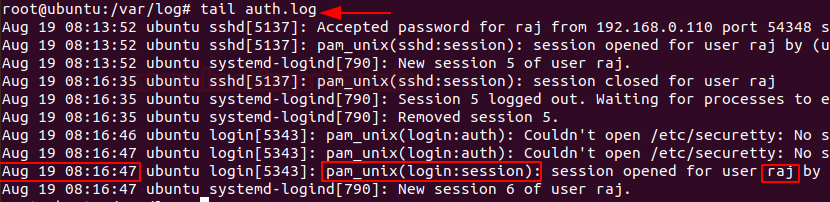
To identify any curious SSH & telnet logins or authentication in the system, you can go to /var/log/ directory and then type
SSH Logs
Telnet Logs
To view the history of commands that the user has typed, you can type history with less or can even mention up to the number of commands you typed last. To view history, you can type

System Resources
System resources can tell you a lot about system logging information, the uptime of the system, the memory space and utilisation of the system etc.
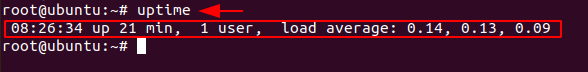
To know whether your Linux system has been running overtime or to see how long the server has been running for, the current time in the system, how many users have currently logged on, and the load averages of system, then you can type
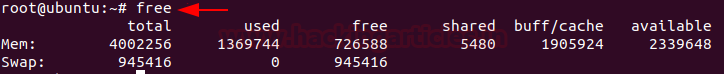
To view the memory utilisation by the system in Linux, the used physical and swap memory in the system, as well as the buffers used by the kernel, you can type,
As an incident responder to check the detail information of the ram, memory space available, buffers and swap on the system, you can type

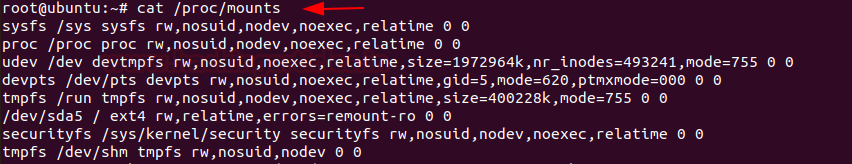
As an incident responder, it’s your responsibility to check if there is an unknown mount on your system, to check the mount present on your system, you can type
Processes
As an incident responder, you should be always curious when you are looking through the output generated by your system. Your curiosity should compel you to view the programs that are currently running in the system, if they necessary to run and if they should be running, and usage of the CPU usage by these processes etc.
To get a dynamic and a real-time visual of all the processes running in the Linux system, summary on the information of the system and the list of processes and their ID numbers or threads managed by Linux Kernel, you can make use of
To see the process status of your Linux and the currently running processes system and the PID. In order to identify abnormal processes that could indicate any malicious activity in the Linux system, you can use

To display more details on a particular process, you can use,

Services
The services in the Linux system can be classified into system and network services. System services include status of services, cron, etc and network services include file transfer, domain name resolution, firewalls, etc. As an incident responder, you identify if there is any anomaly in the services.
To find any abnormally running services, you can use
The incident responder should look for any suspicious scheduled tasks and jobs. To find the scheduled tasks, you can use,

To resolve DNS configuration issues and to avail a list of keywords with values that provide the various types of resolver information, you can use
To check file that translates hostnames or domain names to IP addresses, which is useful for testing changes to the website or the SSL setup, you can use
To check and manage the IPv4 packet filtering and NAT in Linux systems, you can use iptables and can make use of a variety of commands like:
Files
As an incident responder, you should be aware of any abnormal-looking files in your system.
To identify any overly large files in your system and their permissions with their destination, you can use
Whenever any command runs, at which SUID bit is set then its effective UID becomes the owner of that file. So, if you want to find all those files that hold the SUID bit then it can be retrieved by typing the command
As an incident responder, if you want to see an anomalous file that has been present in the system for 2 days, you can use the command,
Network Settings
As an incident responder, you should have a keen eye on the Network activity and setting. It is extremely vital to identify the overall picture of a system network and its health. To obtain the network activity information, you can use various commands.
To see your network interfaces on the system, you can use
To list all the processes that are listening to ports with their PID, you can use
To display all the listening ports in the network use

To display the system ARP cache, you can type
The $PATH displays a list of directories that tells the shell which directories to search for executable files, in order to check for directories that are in your path you can use.

Conclusion:
Hence, one can make use these commands as an incident responder and keep their Linux systems away from the threat.
Author: Jeenali Kothari is a Digital Forensics enthusiast and enjoys technical content writing. You can reach her on Here
The purpose of incident response is nothing but Live Forensics. The investigation can be carried out to obtain any digital evidence. This article mainly focuses on how the incident response can be performed in a Linux system. So, to get you started with this cheatsheet, switch on your Linux machine and open terminal to accomplish these commands.
Table of Contents
- What is incident Response
- User Accounts
- Logs Entries
- System Resources
- Processes
- Services
- Files
- Network
What is Incident Response?
Incident Response can be defined as a course of action that is taken whenever a computer or network security incident occurs. As an Incident Responder, you should always be aware of what should and should not be present in your system.
The security incidents that could be overcome by:
- By examining the running processes
- By having insights on the contents of physical memory.
- By gathering details on hostname, IP address, operating systems etc
- Gathering information on system services.
- By identifying all the known and unknown users logged onto the system.
- By inspecting network connections, open ports and any network activity.
- By determining the various files present
User Accounts
As an Incident Responder, it is very important to investigate the user account’s activity. It helps you understand the logged-in users, the existing users, usual or unusual logins, failed login attempts, permissions, access by sudo etc. The various commands to check the user account activity:
To identify whether there is an account in your system that may seem suspicious. This cat command usually fetches all the information about the user account. To do so, type
Code:
cat /etc/passwdThe’ Setuid’ option in Linux is unique file permission. So, on a Linux system when a user wants to make change of password ,they can run the ‘passwd’ command. As the root account is marked as setuid, you can get temporary permission.
Code:
passwd -S [User_Name]Grep is used for searching plain- text for lines that match a regular expression. :0: is used to display ‘UID 0’ files in /etc/passwd file.
Code:
grep :0: /etc/passwdTo Identify and display whether an attacker created any temporary user to perform an attack, type
Code:
find / -nouser -printThe /etc/shadow contains encrypted password, details about the passwords and is only accessible by the root users.
Code:
cat /etc/shadowThe group file displays the information of the groups used by the user. To view the details, type
Code:
cat /etc/groupIf you want to view information about user and group privileges to be displayed, the/ etc/sudoers file can be viewed
Code:
cat /etc/sudoersLog Entries
To view the reports of the most recent login of a particular user or all the users in the Linux system, you can type,
Code:
lastlogTo identify any curious SSH & telnet logins or authentication in the system, you can go to /var/log/ directory and then type
Code:
tail auth.logSSH Logs
Telnet Logs
To view the history of commands that the user has typed, you can type history with less or can even mention up to the number of commands you typed last. To view history, you can type
Code:
history | lessSystem Resources
System resources can tell you a lot about system logging information, the uptime of the system, the memory space and utilisation of the system etc.
To know whether your Linux system has been running overtime or to see how long the server has been running for, the current time in the system, how many users have currently logged on, and the load averages of system, then you can type
Code:
uptimeTo view the memory utilisation by the system in Linux, the used physical and swap memory in the system, as well as the buffers used by the kernel, you can type,
Code:
freeAs an incident responder to check the detail information of the ram, memory space available, buffers and swap on the system, you can type
Code:
cat /proc/meminfoAs an incident responder, it’s your responsibility to check if there is an unknown mount on your system, to check the mount present on your system, you can type
Code:
cat /proc/mountsProcesses
As an incident responder, you should be always curious when you are looking through the output generated by your system. Your curiosity should compel you to view the programs that are currently running in the system, if they necessary to run and if they should be running, and usage of the CPU usage by these processes etc.
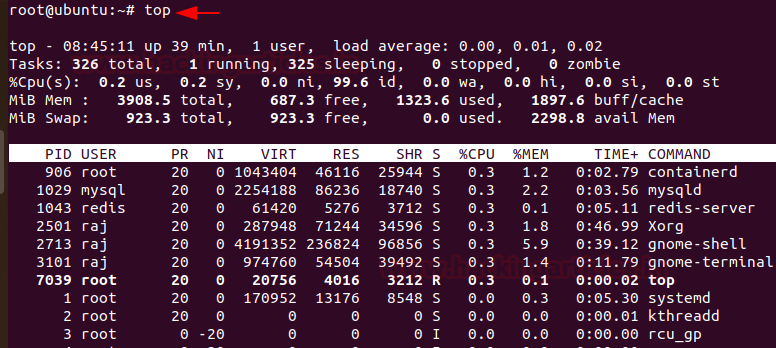
To get a dynamic and a real-time visual of all the processes running in the Linux system, summary on the information of the system and the list of processes and their ID numbers or threads managed by Linux Kernel, you can make use of
Code:
topTo see the process status of your Linux and the currently running processes system and the PID. In order to identify abnormal processes that could indicate any malicious activity in the Linux system, you can use
Code:
ps auxTo display more details on a particular process, you can use,
Code:
lsof –p [pid]Services
The services in the Linux system can be classified into system and network services. System services include status of services, cron, etc and network services include file transfer, domain name resolution, firewalls, etc. As an incident responder, you identify if there is any anomaly in the services.
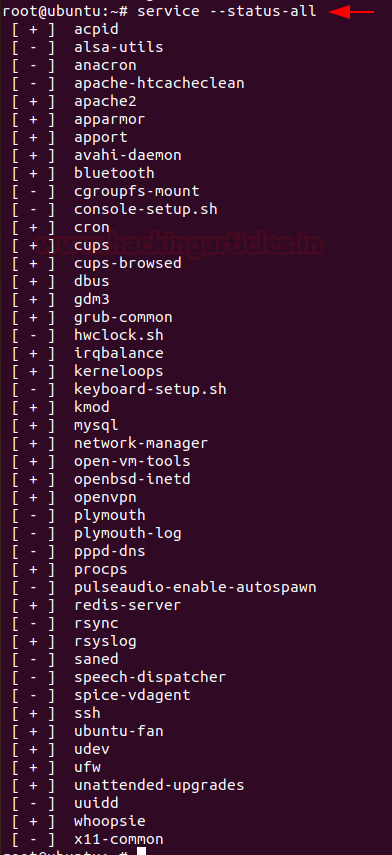
To find any abnormally running services, you can use
Code:
service –-status-allThe incident responder should look for any suspicious scheduled tasks and jobs. To find the scheduled tasks, you can use,
Code:
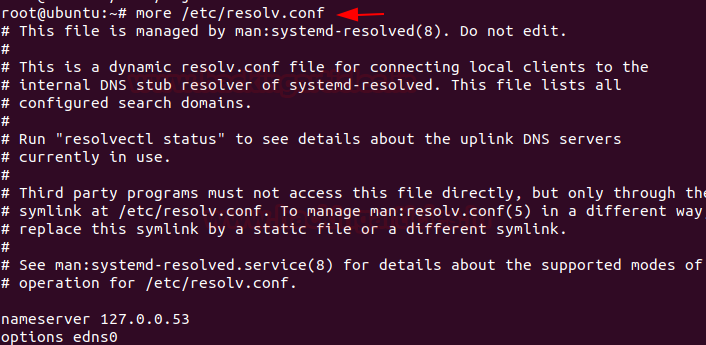
cat /etc/crontabTo resolve DNS configuration issues and to avail a list of keywords with values that provide the various types of resolver information, you can use
Code:
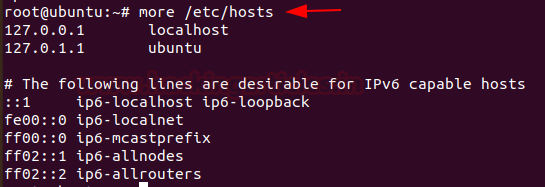
more /etc/resolv.confTo check file that translates hostnames or domain names to IP addresses, which is useful for testing changes to the website or the SSL setup, you can use
Code:
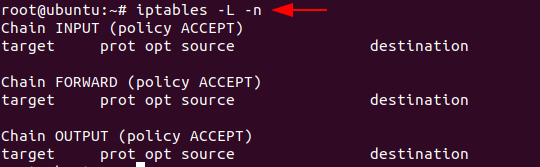
more /etc/hostsTo check and manage the IPv4 packet filtering and NAT in Linux systems, you can use iptables and can make use of a variety of commands like:
Code:
iptables -L -nFiles
As an incident responder, you should be aware of any abnormal-looking files in your system.
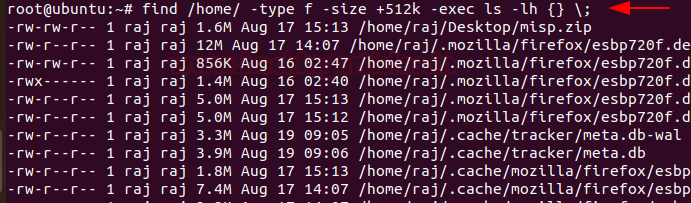
To identify any overly large files in your system and their permissions with their destination, you can use
Code:
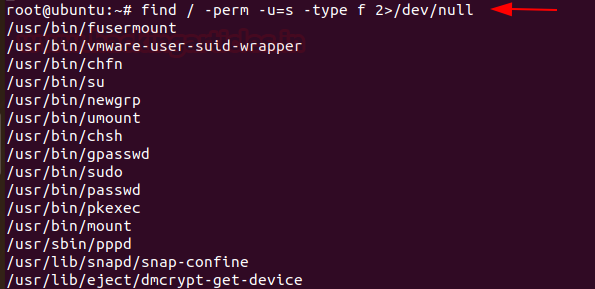
find /home/ -type f -size +512k -exec ls -lh {} \;Whenever any command runs, at which SUID bit is set then its effective UID becomes the owner of that file. So, if you want to find all those files that hold the SUID bit then it can be retrieved by typing the command
Code:
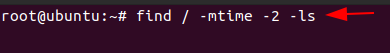
find /etc/ -readable -type f 2>/dev/nullAs an incident responder, if you want to see an anomalous file that has been present in the system for 2 days, you can use the command,
Code:
find / -mtime -2 -lsNetwork Settings
As an incident responder, you should have a keen eye on the Network activity and setting. It is extremely vital to identify the overall picture of a system network and its health. To obtain the network activity information, you can use various commands.
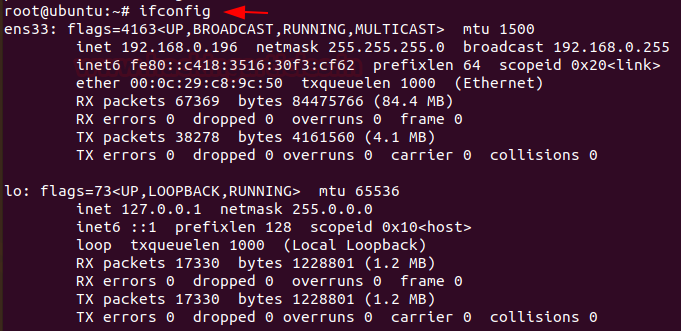
To see your network interfaces on the system, you can use
Code:
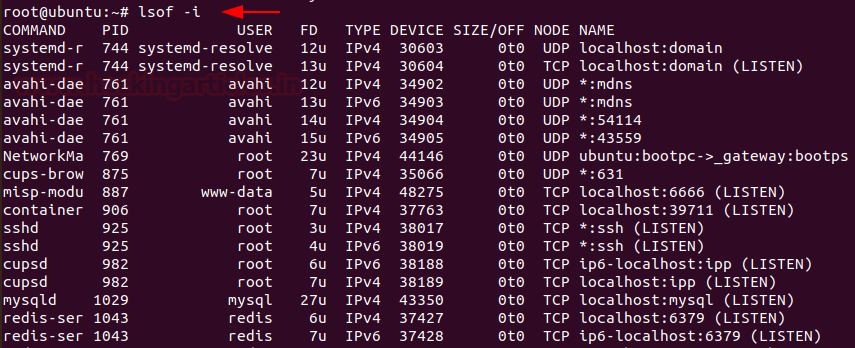
ifconfigTo list all the processes that are listening to ports with their PID, you can use
Code:
lsof -iTo display all the listening ports in the network use
Code:
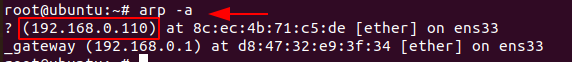
netstat -napTo display the system ARP cache, you can type
Code:
arp -aThe $PATH displays a list of directories that tells the shell which directories to search for executable files, in order to check for directories that are in your path you can use.
Code:
echo $PATHConclusion:
Hence, one can make use these commands as an incident responder and keep their Linux systems away from the threat.
Author: Jeenali Kothari is a Digital Forensics enthusiast and enjoys technical content writing. You can reach her on Here