BloodyGraphics
Human-AI Interaction Specialist
2
MONTHS
2 2 MONTHS OF SERVICE
LEVEL 1
300 XP
Getting Started
I've used CDN for Bootstrap and jQuery in this tutorial so, you need internet connection for them to work.
Chart.js used in this tutorial is included in the downloadable file of this tutorial.
Creating our Database
First, we're going to create our database.
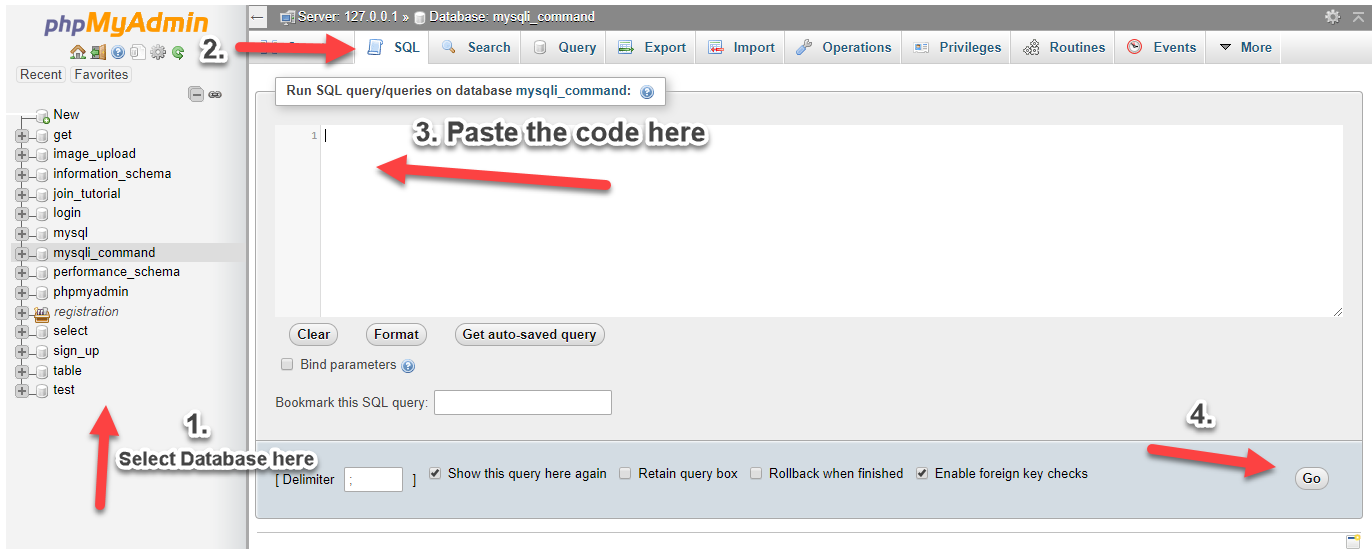
1. Open phpMyAdmin.
2. Click databases, create a database and name it as pie.
3. After creating a database, click the SQL and paste the below codes. See image below for detailed instruction.
Inserting Data into our Database
Next, we insert sample data to our database to be used in our chart.
1. Click pie database that we have created earlier.
2. Click SQL and paste the following codes.
3. Click Go button below.
index.php
This is our index which contains our simple add form and our statistical representation of data from database. This also contains our doughnut chart script.
addproduct.php
This is our PHP code in adding data into our database.
data.php
Lastly, this is our PHP code that contains our data that we're gonna be using in our chart.js to make statistical data in the form of doughnut chart.
Download
I've used CDN for Bootstrap and jQuery in this tutorial so, you need internet connection for them to work.
Chart.js used in this tutorial is included in the downloadable file of this tutorial.
Creating our Database
First, we're going to create our database.
1. Open phpMyAdmin.
2. Click databases, create a database and name it as pie.
3. After creating a database, click the SQL and paste the below codes. See image below for detailed instruction.
- CREATE
TABLE
`category`
(
- `catid`
INT
(
11
)
NOT
NULL
AUTO_INCREMENT
,
- `catname`
VARCHAR
(
30
)
NOT
NULL
,
- PRIMARY
KEY
(
`catid`
)
- )
ENGINE=
InnoDB DEFAULT
CHARSET=
latin1;
- CREATE
TABLE
`product`
(
- `prodid`
INT
(
11
)
NOT
NULL
AUTO_INCREMENT
,
- `catid`
INT
(
11
)
NOT
NULL
,
- `prodname`
VARCHAR
(
30
)
NOT
NULL
,
- PRIMARY
KEY
(
`prodid`
)
- )
ENGINE=
InnoDB DEFAULT
CHARSET=
latin1;
Inserting Data into our Database
Next, we insert sample data to our database to be used in our chart.
1. Click pie database that we have created earlier.
2. Click SQL and paste the following codes.
- INSERT
INTO
`category`
(
`catid`
,
`catname`
)
VALUES
- (
1
,
'Samsung'
)
,
- (
2
,
'Apple'
)
,
- (
3
,
'Vivo'
)
,
- (
4
,
'Sony'
)
,
- (
5
,
'Nokia'
)
;
- INSERT
INTO
`product`
(
`prodid`
,
`catid`
,
`prodname`
)
VALUES
- (
2
,
1
,
'Galaxy Note FE '
)
,
- (
3
,
1
,
'Galaxy J7 +'
)
,
- (
4
,
1
,
'Galaxy J7 Core'
)
,
- (
5
,
1
,
'Galaxy Note 8'
)
,
- (
6
,
1
,
'Galaxy J5 Prime'
)
,
- (
7
,
2
,
'iPhone 7'
)
,
- (
8
,
2
,
'iPhone 7 +'
)
,
- (
9
,
2
,
'iPhone SE'
)
,
- (
10
,
2
,
'iPhone 6S'
)
,
- (
11
,
3
,
'Vivo Y53'
)
,
- (
12
,
3
,
'Vivo V7+'
)
,
- (
13
,
3
,
'Vivo V5'
)
,
- (
14
,
3
,
'Vivo Y55'
)
,
- (
15
,
4
,
'Sony Xperia XZ Premium'
)
,
- (
16
,
4
,
'Sony Xperia XZ1'
)
,
- (
17
,
4
,
'Sony Xperia XZ'
)
,
- (
18
,
4
,
'Sony Xperia XZs'
)
,
- (
19
,
4
,
'Sony Xperia Z5 Dual'
)
,
- (
20
,
4
,
'Sony Xperia Z5 Premium Dual'
)
,
- (
21
,
4
,
'Sony Xperia C3'
)
,
- (
22
,
4
,
'Sony Xperia C5 Ultra Dual'
)
,
- (
23
,
5
,
'Nokia 5'
)
,
- (
24
,
5
,
'Nokia 6'
)
,
- (
25
,
5
,
'Nokia Lumia 530'
)
,
- (
26
,
5
,
'Nokia Lumia 950'
)
,
- (
27
,
4
,
'Sony Xperia XA1'
)
;
3. Click Go button below.
index.php
This is our index which contains our simple add form and our statistical representation of data from database. This also contains our doughnut chart script.
- <!DOCTYPE html>
- <html>
- <head>
- <title>Doughnut Chart using Chart.js with PHP/MySQLi</title>
- <link rel="stylesheet" href="https://maxcdn.bootstrapcdn.com/bootstrap/3.3.7/css/bootstrap.min.css" />
- <script src="https://ajax.googleapis.com/ajax/libs/jquery/3.1.0/jquery.min.js"></script>
- <script src="https://maxcdn.bootstrapcdn.com/bootstrap/3.3.7/js/bootstrap.min.js"></script>
- <!-- ChartJS -->
- <script src="chart.js/Chart.js"></script>
- </head>
- <body>
- <div class="container">
- <h1 class="page-header text-center">Doughnut Chart using Chart.js with PHP/MySQLi</h1>
- <div class="row">
- <div class="col-md-3">
- <h3 class="page-header text-center">Add Product</h3>
- <form method="POST" action="addproduct.php">
- <div class="form-group">
- <label>Category:</label>
- <select class="form-control" name="category">
- <?php
- //connection
- $conn
=
new
mysqli(
"localhost"
,
"root"
,
""
,
"pie"
)
;
- if
(
$conn
->
connect_error
)
{
- die
(
"Connection failed: "
.
$conn
->
connect_error
)
;
- }
- $sql
=
"select * from category"
;
- $query
=
$conn
->
query
(
$sql
)
;
- while
(
$row
=
$query
->
fetch_array
(
)
)
{
- ?>
- <option value="<?php
echo
$row
[
'catid'
]
;
?>
"><?php
echo
$row
[
'catname'
]
;
?>
</option>
- <?php
- }
- ?>
- </select>
- </div>
- <div class="form-group">
- <label>Product Name:</label>
- <input type="text" class="form-control" name="pname">
- </div>
- <button type="submit" class="btn btn-primary"><span class="glyphicon glyphicon-floppy-disk"></span> Save</button>
- </form>
- </div>
- <div class="col-md-9">
- <div class="box box-success">
- <div class="box-header with-border">
- <?php
- //set timezone
- //date_default_timezone_set('Asia/Manila');
- $year
=
date
(
'Y'
)
;
- ?>
- <h3 class="box-title">Phone Brands</h3>
- </div>
- <div class="box-body">
- <canvas id="pieChart" style="height:250px"></canvas>
- </div>
- <!-- /.box-body -->
- </div>
- </div>
- </div>
- </div>
- <?php
include
(
'data.php'
)
;
?>
- <script>
- $(function () {
- var pieChartCanvas = $('#pieChart').get(0).getContext('2d')
- var pieChart = new Chart(pieChartCanvas)
- var PieData = [
- {
- value : <?php
echo
$samsung
;
?>
,
- color : '#f56954',
- highlight: '#f56954',
- label : 'Samsung'
- },
- {
- value : <?php
echo
$apple
;
?>
,
- color : '#00a65a',
- highlight: '#00a65a',
- label : 'Apple'
- },
- {
- value : <?php
echo
$vivo
;
?>
,
- color : '#f39c12',
- highlight: '#f39c12',
- label : 'Vivo'
- },
- {
- value : <?php
echo
$sony
;
?>
,
- color : '#00c0ef',
- highlight: '#00c0ef',
- label : 'Sony'
- },
- {
- value : <?php
echo
$nokia
;
?>
,
- color : '#3c8dbc',
- highlight: '#3c8dbc',
- label : 'Nokia'
- }
- ]
- var pieOptions = {
- //Boolean - Whether we should show a stroke on each segment
- segmentShowStroke : true,
- //String - The colour of each segment stroke
- segmentStrokeColor : '#fff',
- //Number - The width of each segment stroke
- segmentStrokeWidth : 2,
- //Number - The percentage of the chart that we cut out of the middle
- percentageInnerCutout: 50, // This is 0 for Pie charts
- //Number - Amount of animation steps
- animationSteps : 100,
- //String - Animation easing effect
- animationEasing : 'easeOutBounce',
- //Boolean - Whether we animate the rotation of the Doughnut
- animateRotate : true,
- //Boolean - Whether we animate scaling the Doughnut from the centre
- animateScale : false,
- //Boolean - whether to make the chart responsive to window resizing
- responsive : true,
- // Boolean - whether to maintain the starting aspect ratio or not when responsive, if set to false, will take up entire container
- maintainAspectRatio : true,
- //String - A legend template
- legendTemplate : '<ul class="<%=
name.
toLowerCase(
)
%>
-legend"><%
for
(
var
i=
0
;
i<
segments.
length;
i++
)
{
%>
<li><span style="background-color:<%=
segments[
i]
.
fillColor%>
"></span><%
if
(
segments[
i]
.
label)
{
%>
<%=
segments[
i]
.
label%>
<%
}
%>
</li><%
}
%>
</ul>'
- }
- //Create pie or douhnut chart
- // You can switch between pie and douhnut using the method below.
- pieChart.Doughnut(PieData, pieOptions)
- })
- </script>
- </body>
- </html>
addproduct.php
This is our PHP code in adding data into our database.
- <?php
- $conn
=
new
mysqli(
"localhost"
,
"root"
,
""
,
"pie"
)
;
- if
(
$conn
->
connect_error
)
{
- die
(
"Connection failed: "
.
$conn
->
connect_error
)
;
- }
- $category
=
$_POST
[
'category'
]
;
- $pname
=
$_POST
[
'pname'
]
;
- $sql
=
"insert into product (catid, prodname) values ('$category
', '$pname
')"
;
- $conn
->
query
(
$sql
)
;
- header
(
'location:index.php'
)
;
- ?>
data.php
Lastly, this is our PHP code that contains our data that we're gonna be using in our chart.js to make statistical data in the form of doughnut chart.
- <?php
- $conn
=
new
mysqli(
"localhost"
,
"root"
,
""
,
"pie"
)
;
- if
(
$conn
->
connect_error
)
{
- die
(
"Connection failed: "
.
$conn
->
connect_error
)
;
- }
- //$cat = array();
- //for Samsung
- $sql
=
"select * from product left join category on category.catid=product.catid where product.catid='1'"
;
- $query
=
$conn
->
query
(
$sql
)
;
- $samsung
=
$query
->
num_rows
;
- //for Apple
- $sql
=
"select * from product left join category on category.catid=product.catid where product.catid='2'"
;
- $aquery
=
$conn
->
query
(
$sql
)
;
- $apple
=
$aquery
->
num_rows
;
- //for Vivo
- $sql
=
"select * from product left join category on category.catid=product.catid where product.catid='3'"
;
- $vquery
=
$conn
->
query
(
$sql
)
;
- $vivo
=
$vquery
->
num_rows
;
- //for Sony
- $sql
=
"select * from product left join category on category.catid=product.catid where product.catid='4'"
;
- $squery
=
$conn
->
query
(
$sql
)
;
- $sony
=
$squery
->
num_rows
;
- //for Nokia
- $sql
=
"select * from product left join category on category.catid=product.catid where product.catid='5'"
;
- $nquery
=
$conn
->
query
(
$sql
)
;
- $nokia
=
$nquery
->
num_rows
;
- ?>
- <php>
- That ends this tutorial. Happy Coding :)
Download
You must upgrade your account or reply in the thread to view hidden text.