mr5p3rf3ct
Privilege Access Management Tester
2
MONTHS
2 2 MONTHS OF SERVICE
LEVEL 1
200 XP
Getting Started
I've used CDN for Bootstrap and jQuery in this tutorial so, you need internet connection for them to work.
Chart.js used in this tutorial is included in the downloadable file of this tutorial.
Creating our Database
First, we're going to create our database.
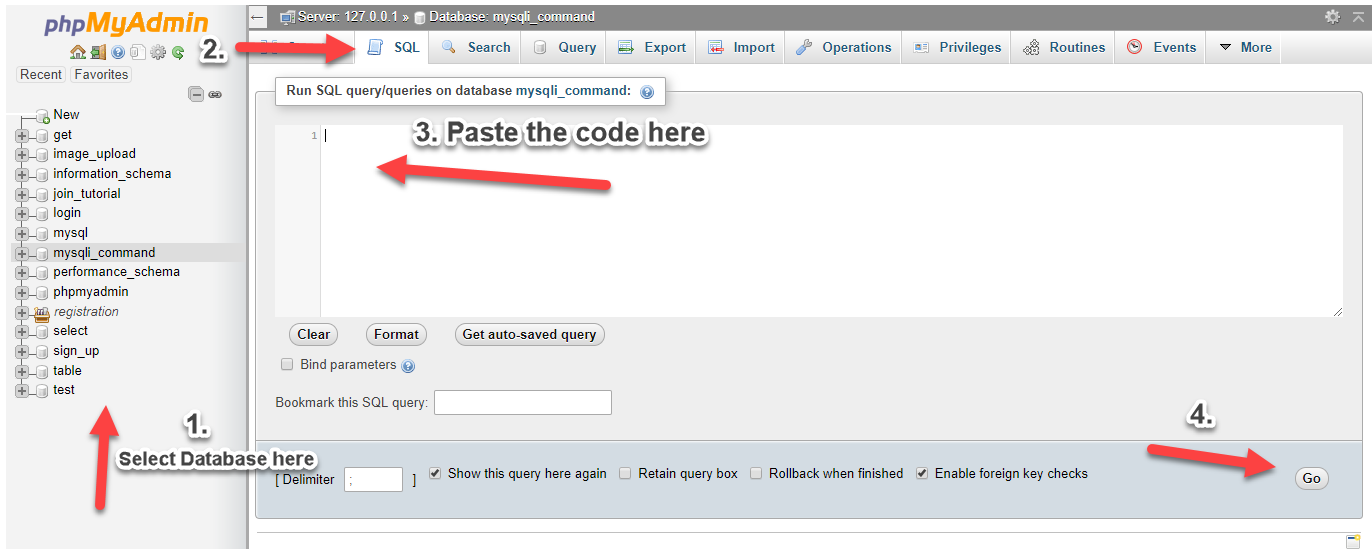
1. Open phpMyAdmin.
2. Click databases, create a database and name it as chartjs.
3. After creating a database, click the SQL and paste the below codes. See image below for detailed instruction.
Inserting Data into our Database
Next, we insert sample data to our database to be used in our chart.
1. Click chartjs database that we have created earlier.
2. Click SQL and paste the following codes.
3. Click Go button below.
index.php
This is our index which contains our simple add form and our statistical representation of data from database. This also contains our line chart script.
addsales.php
This is our PHP code in adding data into our database.
data.php
Lastly, this is our PHP code that contains our data that we're gonna be using in our chart.js to make statistical data in the form of line chart.
That ends this tutorial. Happy Coding :)
Download
I've used CDN for Bootstrap and jQuery in this tutorial so, you need internet connection for them to work.
Chart.js used in this tutorial is included in the downloadable file of this tutorial.
Creating our Database
First, we're going to create our database.
1. Open phpMyAdmin.
2. Click databases, create a database and name it as chartjs.
3. After creating a database, click the SQL and paste the below codes. See image below for detailed instruction.
- CREATE
TABLE
`sales`
(
- `salesid`
INT
(
11
)
NOT
NULL
AUTO_INCREMENT
,
- `amount`
DOUBLE
NOT
NULL
,
- `sales_date`
DATE
NOT
NULL
,
- PRIMARY
KEY
(
`salesid`
)
- )
ENGINE=
InnoDB DEFAULT
CHARSET=
latin1;
Inserting Data into our Database
Next, we insert sample data to our database to be used in our chart.
1. Click chartjs database that we have created earlier.
2. Click SQL and paste the following codes.
- INSERT
INTO
`sales`
(
`salesid`
,
`amount`
,
`sales_date`
)
VALUES
- (
8
,
100
,
'2017-01-01'
)
,
- (
9
,
55
,
'2016-01-01'
)
,
- (
10
,
200
,
'2017-02-02'
)
,
- (
11
,
55
,
'2016-02-02'
)
,
- (
12
,
175
,
'2017-03-03'
)
,
- (
13
,
150
,
'2016-03-03'
)
,
- (
14
,
150
,
'2017-04-04'
)
,
- (
15
,
85
,
'2016-04-04'
)
,
- (
16
,
99
,
'2017-04-04'
)
,
- (
17
,
20
,
'2016-04-04'
)
,
- (
18
,
180
,
'2017-05-05'
)
,
- (
19
,
70
,
'2016-05-05'
)
,
- (
20
,
225
,
'2016-06-06'
)
,
- (
21
,
150
,
'2017-06-06'
)
,
- (
22
,
120
,
'2017-07-07'
)
,
- (
23
,
55
,
'2016-07-07'
)
,
- (
24
,
199
,
'2017-08-08'
)
,
- (
25
,
45
,
'2016-08-08'
)
,
- (
26
,
130
,
'2017-09-09'
)
,
- (
27
,
75
,
'2016-09-09'
)
,
- (
28
,
300
,
'2017-10-10'
)
,
- (
29
,
35
,
'2016-10-10'
)
,
- (
30
,
250
,
'2017-11-11'
)
,
- (
31
,
20
,
'2016-11-11'
)
,
- (
32
,
220
,
'2017-12-12'
)
,
- (
33
,
200
,
'2016-12-12'
)
,
- (
34
,
45
,
'2016-01-05'
)
;
3. Click Go button below.
index.php
This is our index which contains our simple add form and our statistical representation of data from database. This also contains our line chart script.
- <!DOCTYPE html>
- <html>
- <head>
- <title>Line Chart using Chart.js with PHP/MySQLi</title>
- <link rel="stylesheet" href="https://maxcdn.bootstrapcdn.com/bootstrap/3.3.7/css/bootstrap.min.css" />
- <script src="https://ajax.googleapis.com/ajax/libs/jquery/3.1.0/jquery.min.js"></script>
- <script src="https://maxcdn.bootstrapcdn.com/bootstrap/3.3.7/js/bootstrap.min.js"></script>
- <!-- ChartJS -->
- <script src="chart.js/Chart.js"></script>
- </head>
- <body>
- <div class="container">
- <h1 class="page-header text-center">Line Chart using Chart.js with PHP/MySQLi</h1>
- <div class="row">
- <div class="col-md-3">
- <h3 class="page-header text-center">Add Sales</h3>
- <form method="POST" action="addsales.php">
- <div class="form-group">
- <label>Amount:</label>
- <input type="text" class="form-control" name="amount" required>
- </div>
- <div class="form-group">
- <label>Date:</label>
- <input type="date" class="form-control" name="sales_date" required>
- </div>
- <button type="submit" class="btn btn-primary"><span class="glyphicon glyphicon-floppy-disk"></span> Save</button>
- </form>
- </div>
- <div class="col-md-9">
- <div class="box box-success">
- <div class="box-header with-border">
- <?php
- //set timezone
- //date_default_timezone_set('Asia/Manila');
- $year
=
date
(
'Y'
)
;
- ?>
- <h3 class="box-title">Sales Report (<?php
echo
$year
-
1
;
?>
vs <?php
echo
$year
;
?>
)</h3>
- </div>
- <div class="box-body">
- <div class="chart">
- <canvas id="lineChart" style="height:250px"></canvas>
- </div>
- </div>
- <!-- /.box-body -->
- </div>
- </div>
- </div>
- </div>
- <?php
include
(
'data.php'
)
;
?>
- <script>
- $(function () {
- var lineChartData = {
- labels : ['January', 'February', 'March', 'April', 'May', 'June', 'July', 'August', 'September', 'October', 'November', 'December'],
- datasets: [
- {
- label : 'Previous Year',
- fillColor : 'rgba(210, 214, 222, 1)',
- strokeColor : 'rgba(210, 214, 222, 1)',
- pointColor : 'rgba(210, 214, 222, 1)',
- pointStrokeColor : '#c1c7d1',
- pointHighlightFill : '#fff',
- pointHighlightStroke: 'rgba(220,220,220,1)',
- data : [ "<?php
echo
$pjan
;
?>
",
- "<?php
echo
$pfeb
;
?>
",
- "<?php
echo
$pmar
;
?>
",
- "<?php
echo
$papr
;
?>
",
- "<?php
echo
$pmay
;
?>
",
- "<?php
echo
$pjun
;
?>
",
- "<?php
echo
$pjul
;
?>
",
- "<?php
echo
$paug
;
?>
",
- "<?php
echo
$psep
;
?>
",
- "<?php
echo
$poct
;
?>
",
- "<?php
echo
$pnov
;
?>
",
- "<?php
echo
$pdec
;
?>
"
- ]
- },
- {
- label : 'This Year',
- fillColor : 'rgba(60,141,188,0.9)',
- strokeColor : 'rgba(60,141,188,0.8)',
- pointColor : '#3b8bba',
- pointStrokeColor : 'rgba(60,141,188,1)',
- pointHighlightFill : '#fff',
- pointHighlightStroke: 'rgba(60,141,188,1)',
- data : [ "<?php
echo
$tjan
;
?>
",
- "<?php
echo
$tfeb
;
?>
",
- "<?php
echo
$tmar
;
?>
",
- "<?php
echo
$tapr
;
?>
",
- "<?php
echo
$tmay
;
?>
",
- "<?php
echo
$tjun
;
?>
",
- "<?php
echo
$tjul
;
?>
",
- "<?php
echo
$taug
;
?>
",
- "<?php
echo
$tsep
;
?>
",
- "<?php
echo
$toct
;
?>
",
- "<?php
echo
$tnov
;
?>
",
- "<?php
echo
$tdec
;
?>
"
- ]
- }
- ]
- }
- var lineChartCanvas = $('#lineChart').get(0).getContext('2d')
- var lineChart = new Chart(lineChartCanvas)
- var lineChartOptions = {
- //Boolean - If we should show the scale at all
- showScale : true,
- //Boolean - Whether grid lines are shown across the chart
- scaleShowGridLines : false,
- //String - Colour of the grid lines
- scaleGridLineColor : 'rgba(0,0,0,.05)',
- //Number - Width of the grid lines
- scaleGridLineWidth : 1,
- //Boolean - Whether to show horizontal lines (except X axis)
- scaleShowHorizontalLines: true,
- //Boolean - Whether to show vertical lines (except Y axis)
- scaleShowVerticalLines : true,
- //Boolean - Whether the line is curved between points
- bezierCurve : true,
- //Number - Tension of the bezier curve between points
- bezierCurveTension : 0.3,
- //Boolean - Whether to show a dot for each point
- pointDot : false,
- //Number - Radius of each point dot in pixels
- pointDotRadius : 4,
- //Number - Pixel width of point dot stroke
- pointDotStrokeWidth : 1,
- //Number - amount extra to add to the radius to cater for hit detection outside the drawn point
- pointHitDetectionRadius : 20,
- //Boolean - Whether to show a stroke for datasets
- datasetStroke : true,
- //Number - Pixel width of dataset stroke
- datasetStrokeWidth : 2,
- //Boolean - Whether to fill the dataset with a color
- datasetFill : true,
- //String - A legend template
- legendTemplate : '<ul class="<%=
name.
toLowerCase(
)
%>
-legend"><%
for
(
var
i=
0
;
i<
datasets.
length;
i++
)
{
%>
<li><span style="background-color:<%=
datasets[
i]
.
lineColor%>
"></span><%
if
(
datasets[
i]
.
label)
{
%>
<%=
datasets[
i]
.
label%>
<%
}
%>
</li><%
}
%>
</ul>',
- //Boolean - whether to maintain the starting aspect ratio or not when responsive, if set to false, will take up entire container
- maintainAspectRatio : true,
- //Boolean - whether to make the chart responsive to window resizing
- responsive : true
- }
- lineChartOptions.datasetFill = false
- lineChart.Line(lineChartData, lineChartOptions)
- })
- </script>
- </body>
- </html>
addsales.php
This is our PHP code in adding data into our database.
- <?php
- $conn
=
new
mysqli(
"localhost"
,
"root"
,
""
,
"chartjs"
)
;
- if
(
$conn
->
connect_error
)
{
- die
(
"Connection failed: "
.
$conn
->
connect_error
)
;
- }
- $amount
=
$_POST
[
'amount'
]
;
- $sales_date
=
$_POST
[
'sales_date'
]
;
- $sql
=
"insert into sales (amount, sales_date) values ('$amount
', '$sales_date
')"
;
- $conn
->
query
(
$sql
)
;
- header
(
'location:index.php'
)
;
- ?>
data.php
Lastly, this is our PHP code that contains our data that we're gonna be using in our chart.js to make statistical data in the form of line chart.
- <?php
- $conn
=
new
mysqli(
"localhost"
,
"root"
,
""
,
"chartjs"
)
;
- if
(
$conn
->
connect_error
)
{
- die
(
"Connection failed: "
.
$conn
->
connect_error
)
;
- }
- //set timezone
- //date_default_timezone_set('Asia/Manila');
- $year
=
date
(
'Y'
)
;
- $total
=
array
(
)
;
- for
(
$month
=
1
;
$month
<=
12
;
$month
++
)
{
- $sql
=
"select *, sum(amount) as total from sales where month(sales_date)='$month
' and year(sales_date)='$year
'"
;
- $query
=
$conn
->
query
(
$sql
)
;
- $row
=
$query
->
fetch_array
(
)
;
- $total
[
]
=
$row
[
'total'
]
;
- }
- $tjan
=
$total
[
0
]
;
- $tfeb
=
$total
[
1
]
;
- $tmar
=
$total
[
2
]
;
- $tapr
=
$total
[
3
]
;
- $tmay
=
$total
[
4
]
;
- $tjun
=
$total
[
5
]
;
- $tjul
=
$total
[
6
]
;
- $taug
=
$total
[
7
]
;
- $tsep
=
$total
[
8
]
;
- $toct
=
$total
[
9
]
;
- $tnov
=
$total
[
10
]
;
- $tdec
=
$total
[
11
]
;
- $pyear
=
$year
-
1
;
- $pnum
=
array
(
)
;
- for
(
$pmonth
=
1
;
$pmonth
<=
12
;
$pmonth
++
)
{
- $sql
=
"select *, sum(amount) as ptotal from sales where month(sales_date)='$pmonth
' and year(sales_date)='$pyear
'"
;
- $pquery
=
$conn
->
query
(
$sql
)
;
- $prow
=
$pquery
->
fetch_array
(
)
;
- $ptotal
[
]
=
$prow
[
'ptotal'
]
;
- }
- $pjan
=
$ptotal
[
0
]
;
- $pfeb
=
$ptotal
[
1
]
;
- $pmar
=
$ptotal
[
2
]
;
- $papr
=
$ptotal
[
3
]
;
- $pmay
=
$ptotal
[
4
]
;
- $pjun
=
$ptotal
[
5
]
;
- $pjul
=
$ptotal
[
6
]
;
- $paug
=
$ptotal
[
7
]
;
- $psep
=
$ptotal
[
8
]
;
- $poct
=
$ptotal
[
9
]
;
- $pnov
=
$ptotal
[
10
]
;
- $pdec
=
$ptotal
[
11
]
;
- ?>
That ends this tutorial. Happy Coding :)
Download
You must upgrade your account or reply in the thread to view hidden text.